Let me ask you something—when was the last time you heard someone talk about the VIX? If you're like most people, it might've been during a particularly volatile day in the stock market. But what exactly is the VIX, and why should you care? Think of it as the market's version of a stress test. The VIX, short for Volatility Index, is essentially a gauge that measures how anxious investors are about what's coming next. And let's be real—when the market gets jittery, so do our wallets. So buckle up, because we're diving deep into the world of volatility.
Now, before you think this is just another boring finance article, let me assure you it's not. The VIX isn't just a number—it's a reflection of human behavior, fear, and uncertainty. It's like peeking into the collective subconscious of traders and investors worldwide. And hey, who doesn't love a good peek into the mind of Wall Street?
But here's the thing: understanding the VIX isn't just for finance geeks or day traders. Even if you're just someone trying to grow their savings or plan for retirement, knowing how the VIX works can give you a better sense of when to hold steady and when to maybe, just maybe, tighten your seatbelt. Let's get started, shall we?
What Exactly is the VIX?
Alright, let's break it down. The VIX, officially known as the Cboe Volatility Index, is a real-time market index that represents the market's expectation of 30-day forward-looking volatility. In simpler terms, it's a way to measure how much the S&P 500 is expected to move up or down over the next month. And guess what? It does this by analyzing the prices of options on the S&P 500 index.
Think of the VIX as a crystal ball for the stock market—but instead of predicting the future, it tells you how scared people are about what might happen. When the VIX is high, it means investors are bracing for some serious market turbulence. When it's low, it's like everyone's taking a nice, relaxing stroll through the park. But don't be fooled—calm waters can turn into a storm pretty quickly.
Why the VIX Matters to You
Here's the deal: the VIX isn't just for professional traders. If you've got money in the stock market—whether it's through a retirement account, mutual funds, or even crypto—you're affected by volatility. And the VIX gives you a heads-up about when things might get rocky. It's like having a weather forecast for your investments.
For example, if you see the VIX spiking, it might be a good time to review your portfolio and make sure you're not overexposed to risk. On the flip side, when the VIX is low, it could be a signal that now's a good time to invest in some undervalued stocks. But remember, the market is unpredictable, so don't go making drastic moves based on one number alone.
How is the VIX Calculated?
Now, this is where things get a little technical—but don't worry, I'll keep it simple. The VIX is calculated using the implied volatility of S&P 500 index options. These options give investors the right, but not the obligation, to buy or sell the S&P 500 at a certain price within a specific time frame. By looking at the prices of these options, the VIX can estimate how volatile the market expects the S&P 500 to be over the next 30 days.
Here's the kicker: the VIX doesn't actually predict which direction the market will move—it just tells you how much movement to expect. So if the VIX is high, it means investors think the market could swing sharply either up or down. And if it's low, it means they expect things to stay pretty stable.
Breaking Down the Math
Let's say the VIX is at 20. What does that mean? Well, it means that over the next 30 days, the S&P 500 is expected to move up or down by about 20% on an annualized basis. Now, I know that sounds like a lot, but remember, this is an annualized number. When you break it down to a monthly basis, it's more like a 5.77% swing. Still a bit scary, right?
But here's the thing: the VIX isn't perfect. It's based on expectations, not reality. So while it can give you a good idea of what might happen, it's not a crystal ball. Sometimes the market surprises us, and that's just part of the game.
Historical Context of the VIX
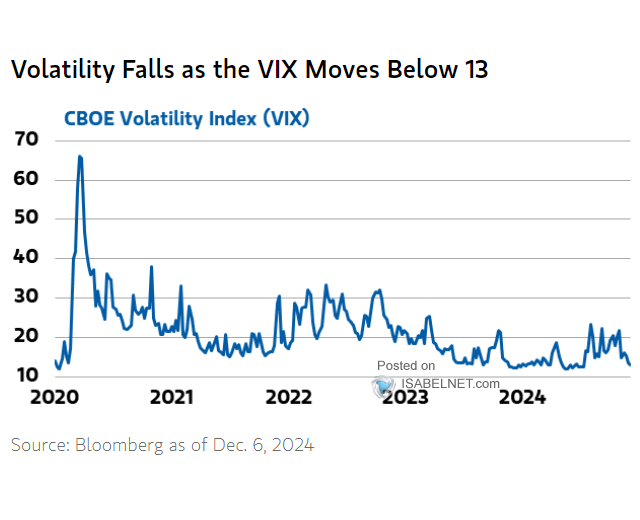
Let's take a trip down memory lane. The VIX was first introduced by the Chicago Board Options Exchange (CBOE) back in 1993. Since then, it's become one of the most widely followed indicators in the financial world. And for good reason—when the VIX spikes, it usually signals that something big is about to happen in the market.
Take the 2008 financial crisis, for example. The VIX hit an all-time high of 89.53 on October 24, 2008. That was a clear sign that investors were absolutely terrified. And sure enough, the market proceeded to tank. On the flip side, during periods of calm, like the mid-2010s, the VIX often hovered around 10 or 12. Those were the good ol' days, weren't they?
Key VIX Moments in History
- 2008 Financial Crisis: VIX hit a record high of 89.53.
- 2018 Market Correction: VIX surged to 50.3 as the market experienced its first major correction in years.
- 2020 Coronavirus Crash: VIX reached 82.69, marking one of the most volatile periods in modern history.
Each of these moments was a reminder that the VIX isn't just a number—it's a reflection of the market's mood. And sometimes, that mood can get downright ugly.
Using the VIX in Your Investment Strategy
So, how can you actually use the VIX to your advantage? Well, there are a few ways. First, you can use it as a contrarian indicator. If the VIX is really high, it might mean that everyone is too scared, and that could be a buying opportunity. Conversely, if it's really low, it might mean that everyone's too complacent, and that could be a sign to take some profits off the table.
Another way to use the VIX is through trading VIX futures or options. These financial instruments allow you to bet on whether volatility will increase or decrease. But here's the thing: trading the VIX can be risky business. It's not for the faint of heart, and it definitely requires a solid understanding of how these markets work.
Pros and Cons of Trading the VIX
- Pros: Potential for high returns, hedge against market downturns.
- Cons: High risk, complex instruments, requires expertise.
So if you're thinking about jumping into VIX trading, make sure you do your homework first. And maybe, just maybe, consult with a financial advisor before you dive headfirst into the deep end.
VIX and Its Relationship with Other Market Indicators
Now, the VIX doesn't exist in a vacuum. It's closely related to other market indicators like the S&P 500, bond yields, and even gold prices. When the VIX goes up, it often means that stocks are going down, bonds are going up, and gold is shining brighter than ever. And that makes sense—if investors are scared, they're gonna flock to safer assets.
But here's the interesting part: sometimes the VIX and the S&P 500 move in opposite directions. When the market is climbing, the VIX tends to fall. And when the market is falling, the VIX tends to rise. It's like they're on a seesaw, balancing each other out.
How the VIX Affects Other Assets
Let's say the VIX is spiking. What happens next? Well, you might see a rush into safe-haven assets like gold and government bonds. At the same time, you might see a sell-off in riskier assets like stocks and cryptocurrencies. It's all about risk appetite—or lack thereof.
And don't forget about the impact on currencies. When the VIX rises, it often leads to a stronger dollar as investors seek safety. But again, this isn't a hard and fast rule. The market is unpredictable, and sometimes it throws you a curveball.
Common Misconceptions About the VIX
Alright, let's clear up some misconceptions. First of all, the VIX isn't a predictor of stock market direction. It's a measure of expected volatility, not a crystal ball. So just because the VIX is high doesn't mean the market is going to crash. It just means that investors are expecting a lot of movement.
Another common misconception is that the VIX is only useful for traders. Wrong again! Even if you're a long-term investor, understanding the VIX can help you make better decisions about when to buy or sell. And let's not forget—knowledge is power.
Setting the Record Straight
- Misconception 1: The VIX predicts market direction. Reality: It measures expected volatility, not direction.
- Misconception 2: The VIX is only for traders. Reality: It's useful for all investors, regardless of experience level.
So next time someone tells you the VIX is just a number, remind them that it's a lot more than that. It's a reflection of the market's mood, and that's something we should all pay attention to.
Future Trends and the VIX
So where is the VIX headed? Well, that's the million-dollar question, isn't it? With the rise of algorithmic trading and the increasing interconnectedness of global markets, the VIX is likely to become even more important in the years to come. And with new innovations like cryptocurrency and decentralized finance, the market is only going to get more complex.
But here's the thing: no matter how much the market changes, one thing will always remain true—the VIX will continue to be a key indicator of market sentiment. And as long as there are investors out there who are scared or complacent, the VIX will be there to tell us about it.
What's Next for the VIX?
As we move into an era of more sophisticated financial instruments and greater market transparency, the VIX will likely evolve to meet the needs of modern investors. Whether that means new ways of calculating volatility or expanded coverage of global markets, one thing is certain—the VIX will continue to be a critical tool for anyone looking to navigate the choppy waters of the stock market.
Conclusion: Embracing Volatility
Alright, let's wrap things up. The VIX isn't just a number—it's a reflection of the market's mood, a gauge of investor sentiment, and a tool for making smarter investment decisions. Whether you're a seasoned trader or a first-time investor, understanding the VIX can give you a better sense of what's going on in the market and how to position yourself for success.
So here's my call to action: take a few minutes each day to check the VIX. It's like checking the weather forecast for your investments. And if you're feeling adventurous, consider learning more about how to trade the VIX or use it in your investment strategy. Just remember—always do your homework and never bet the farm on one number.
Final Thoughts
Investing is all about managing risk, and the VIX is one of the best tools out there for doing just that. So don't be afraid to embrace volatility—it's part of the game. And who knows? Maybe the next time you see the VIX spike, you'll be the one telling your friends what it means. Now that's what I call being in the know.
Table of Contents